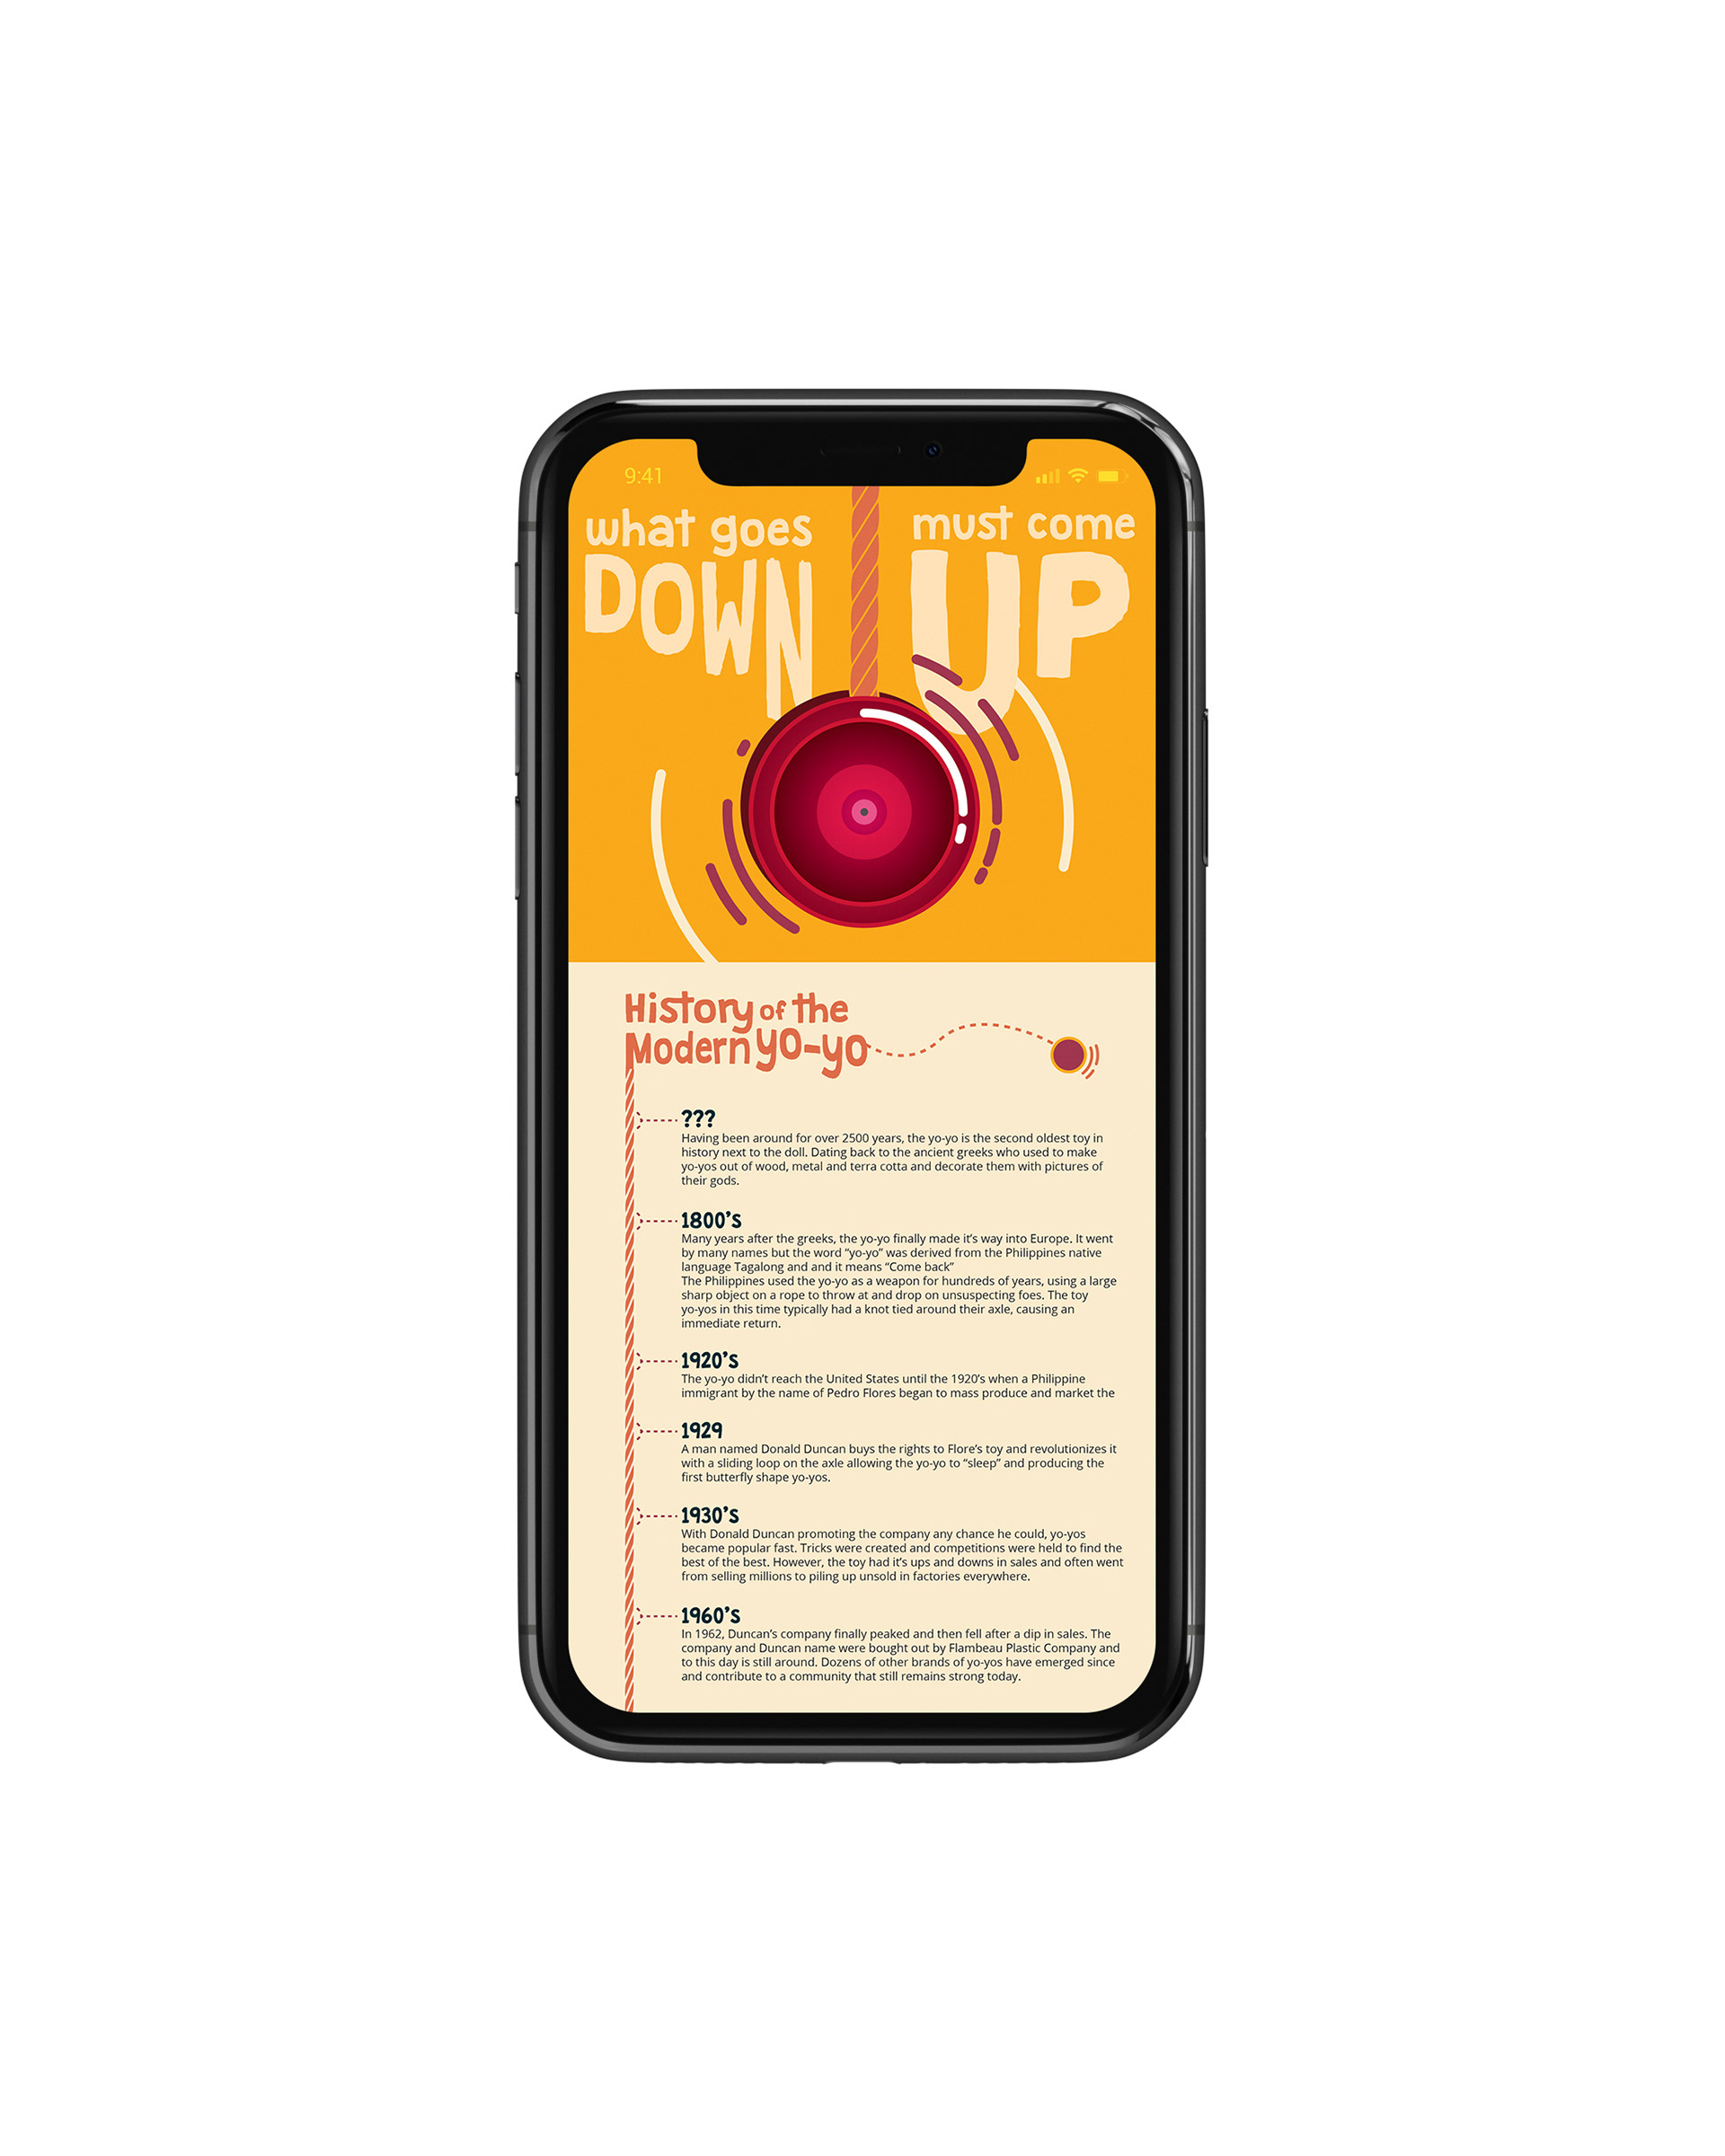
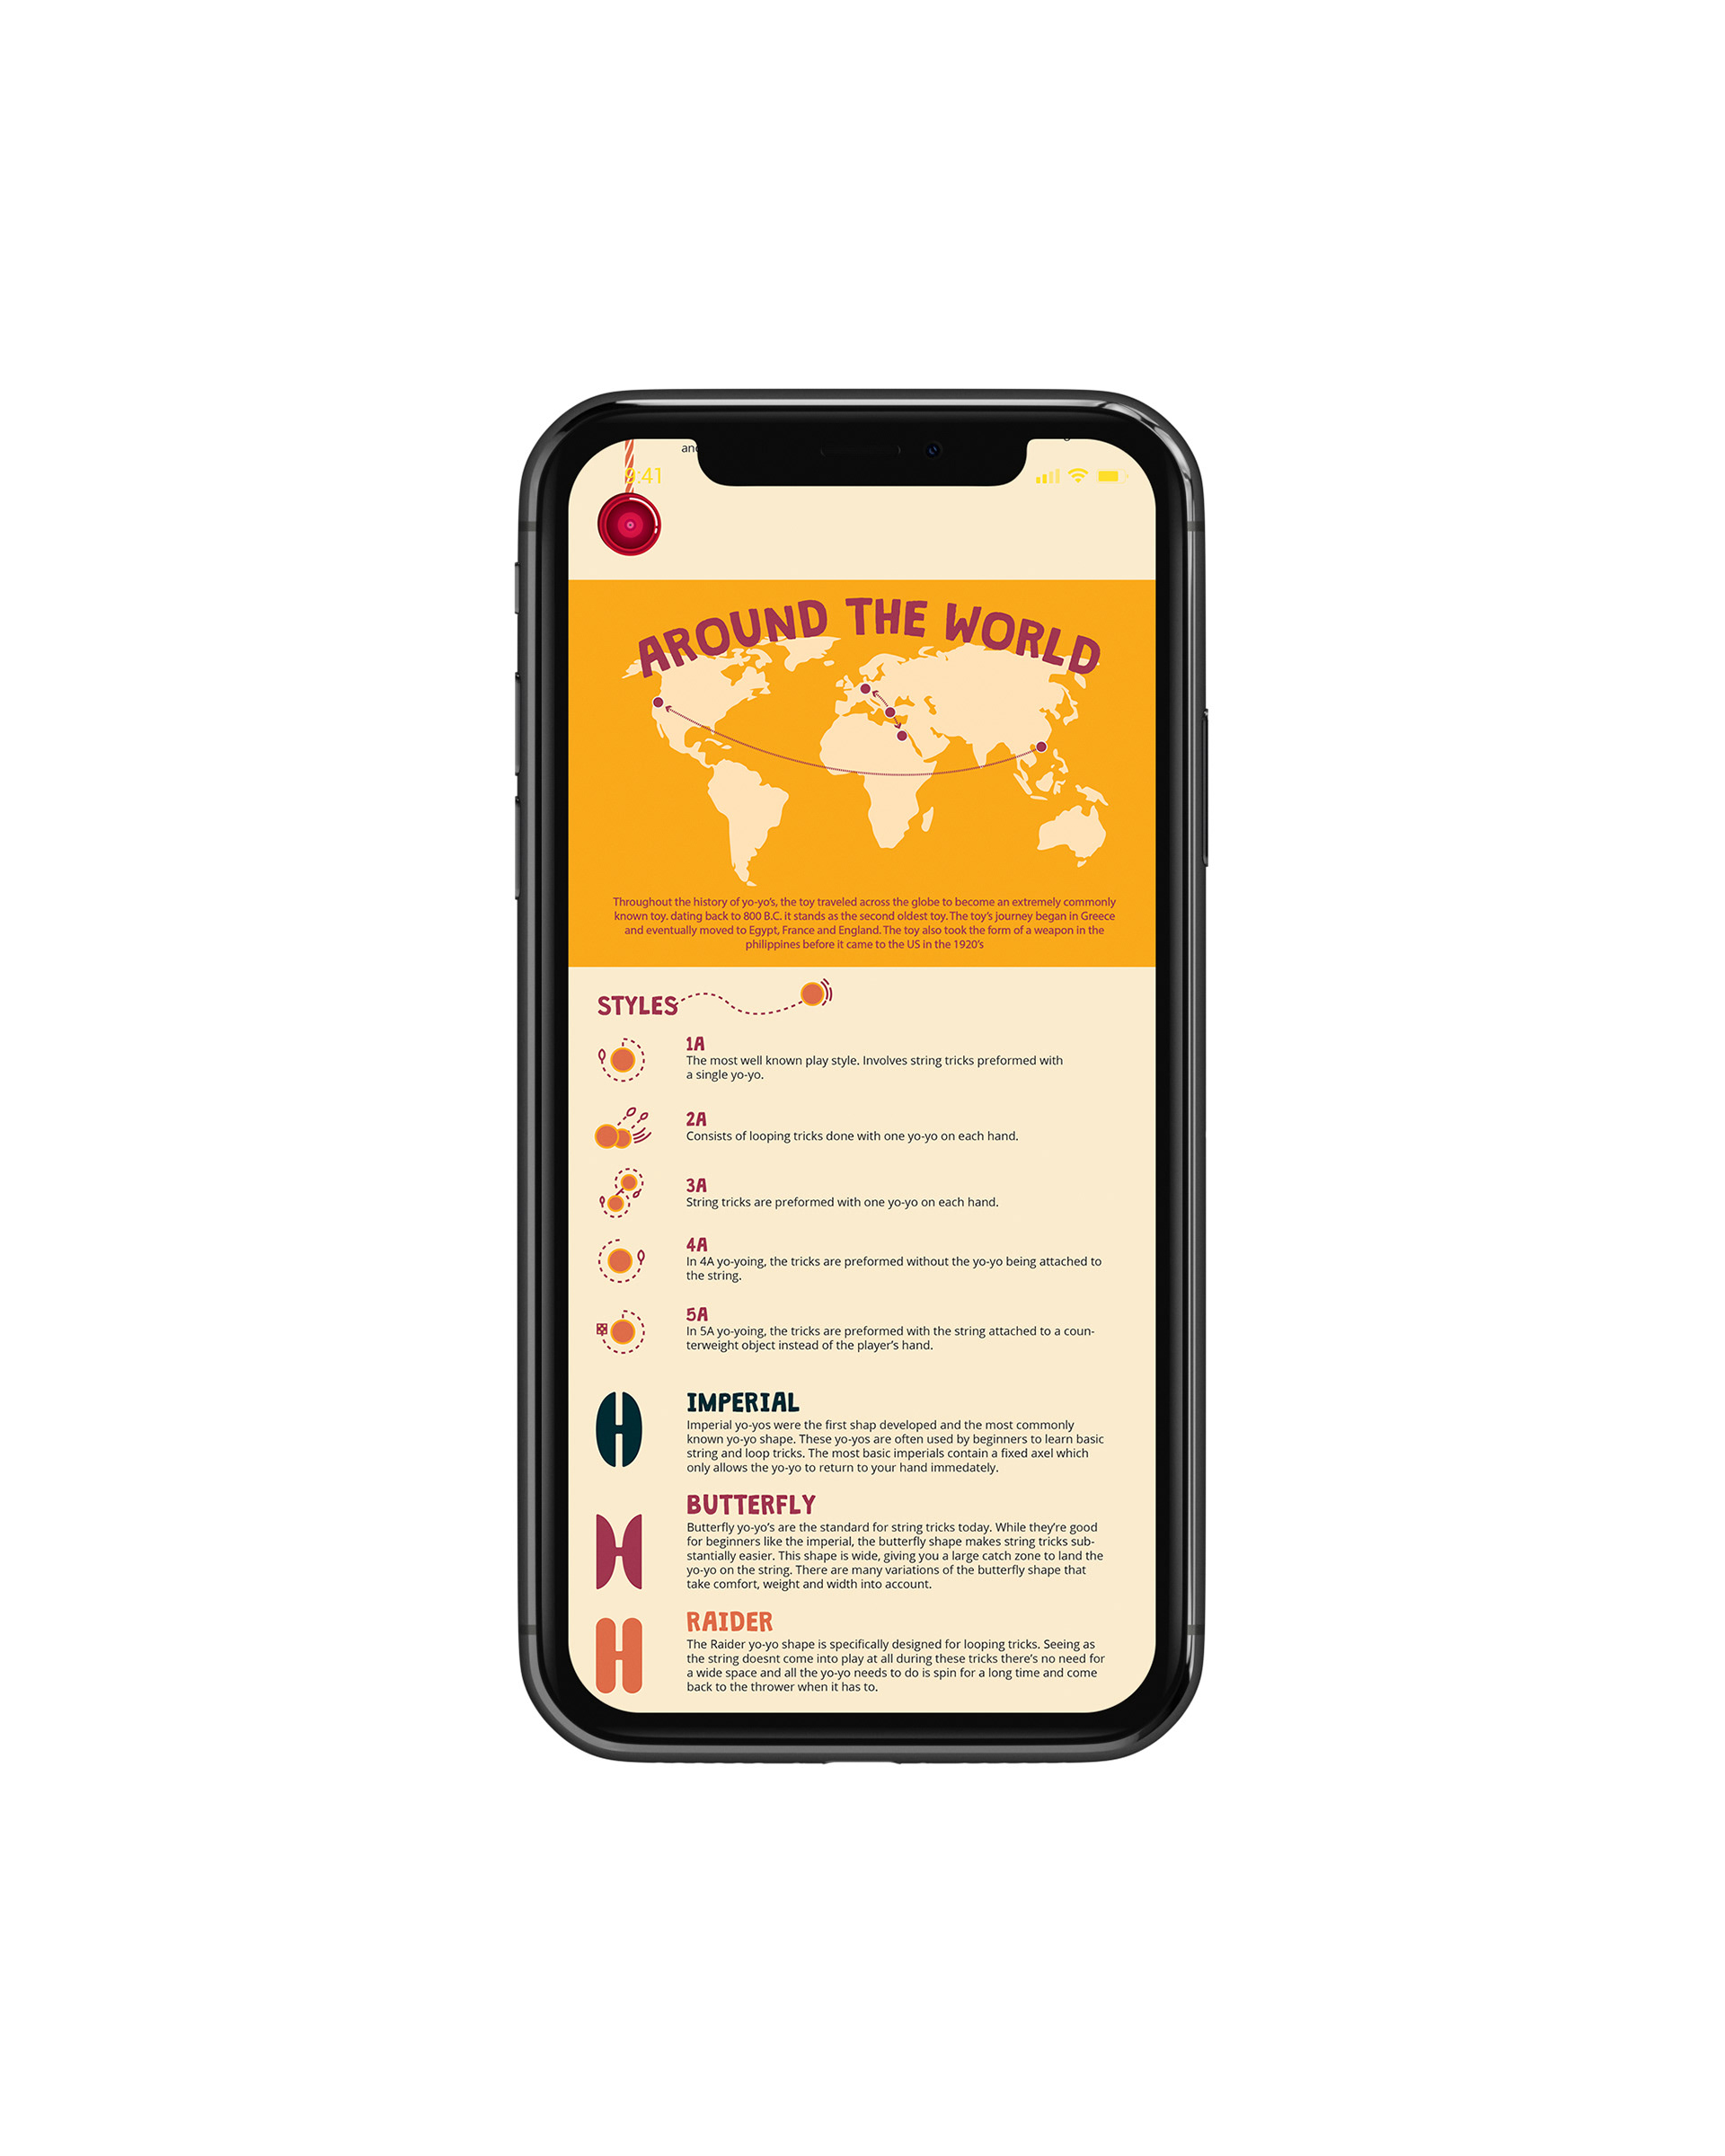
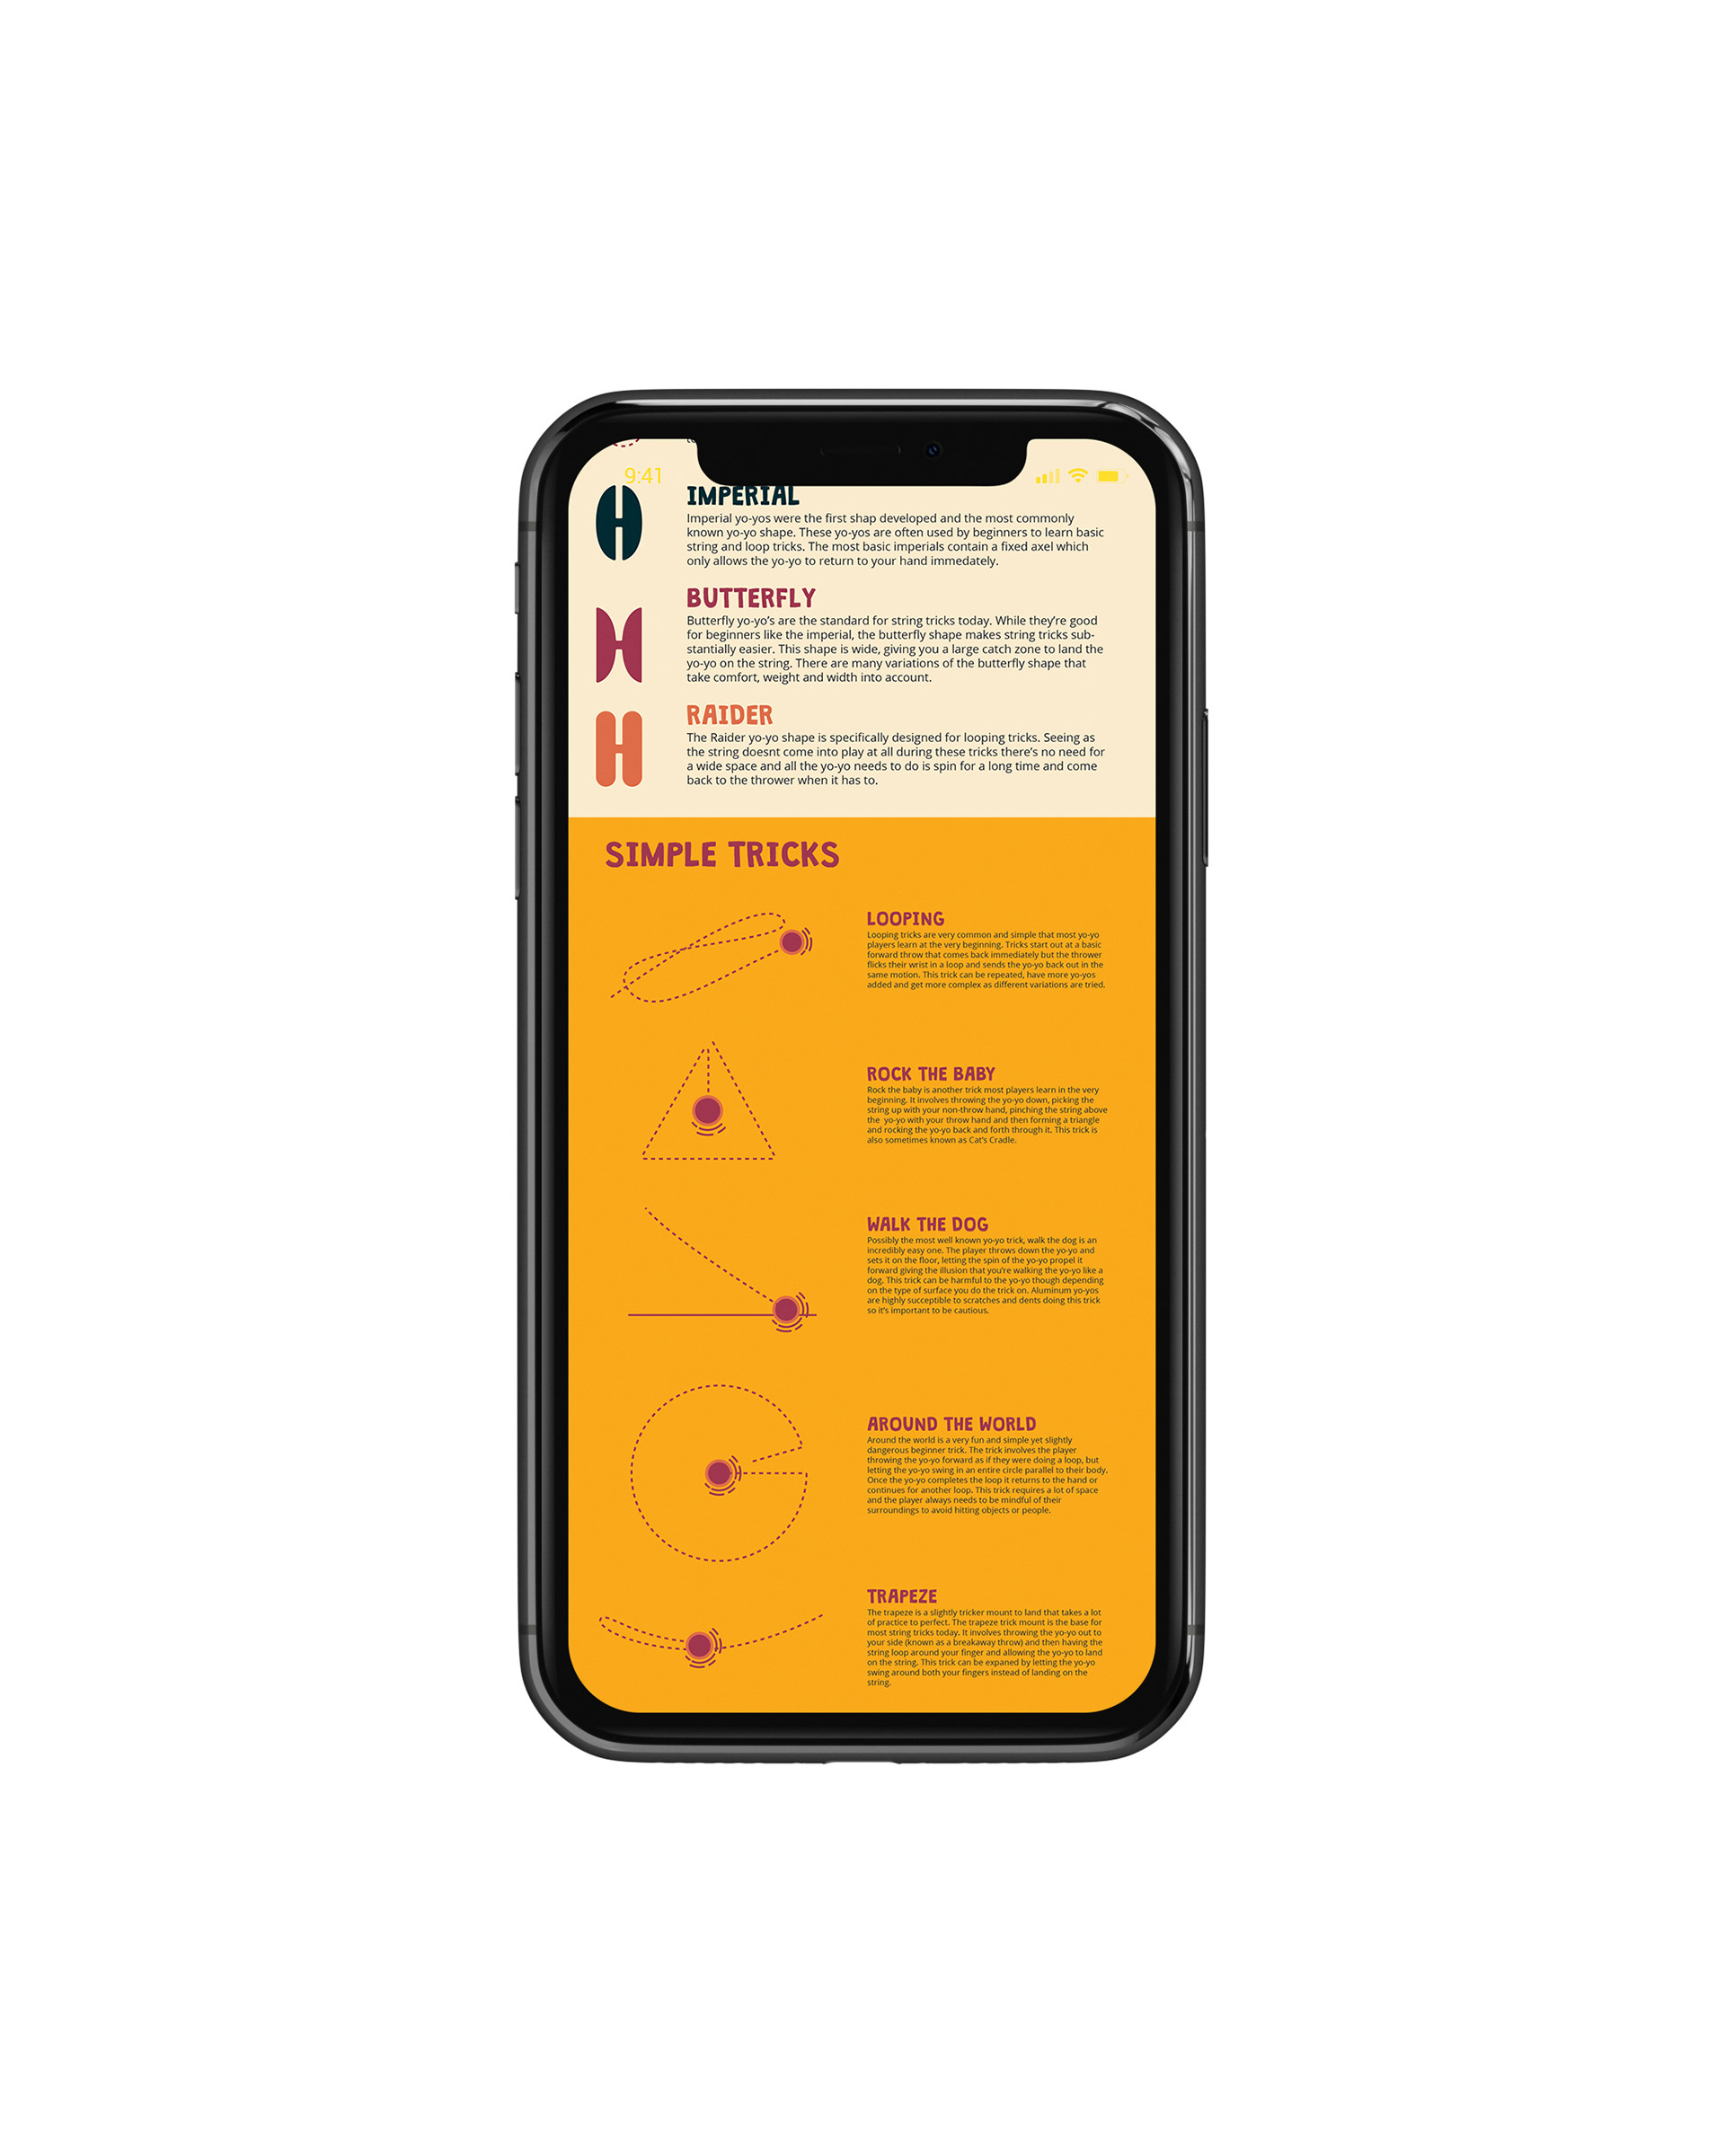
As someone whose been doing yo-yo tricks since middle school and is pretty knowledgeable on the subject, I decided there would be no better topic to create a data driven infographic for. It was a lot of fun creating the graphics and conceptualizing the visual styles displayed across both horizontal, vertical and motion graphics.
Additionally, I decided to create a short animation for a simple trick that showed each step and looped so the viewer wouldn't have to manually restart themselves and lose their place in learning the trick.
